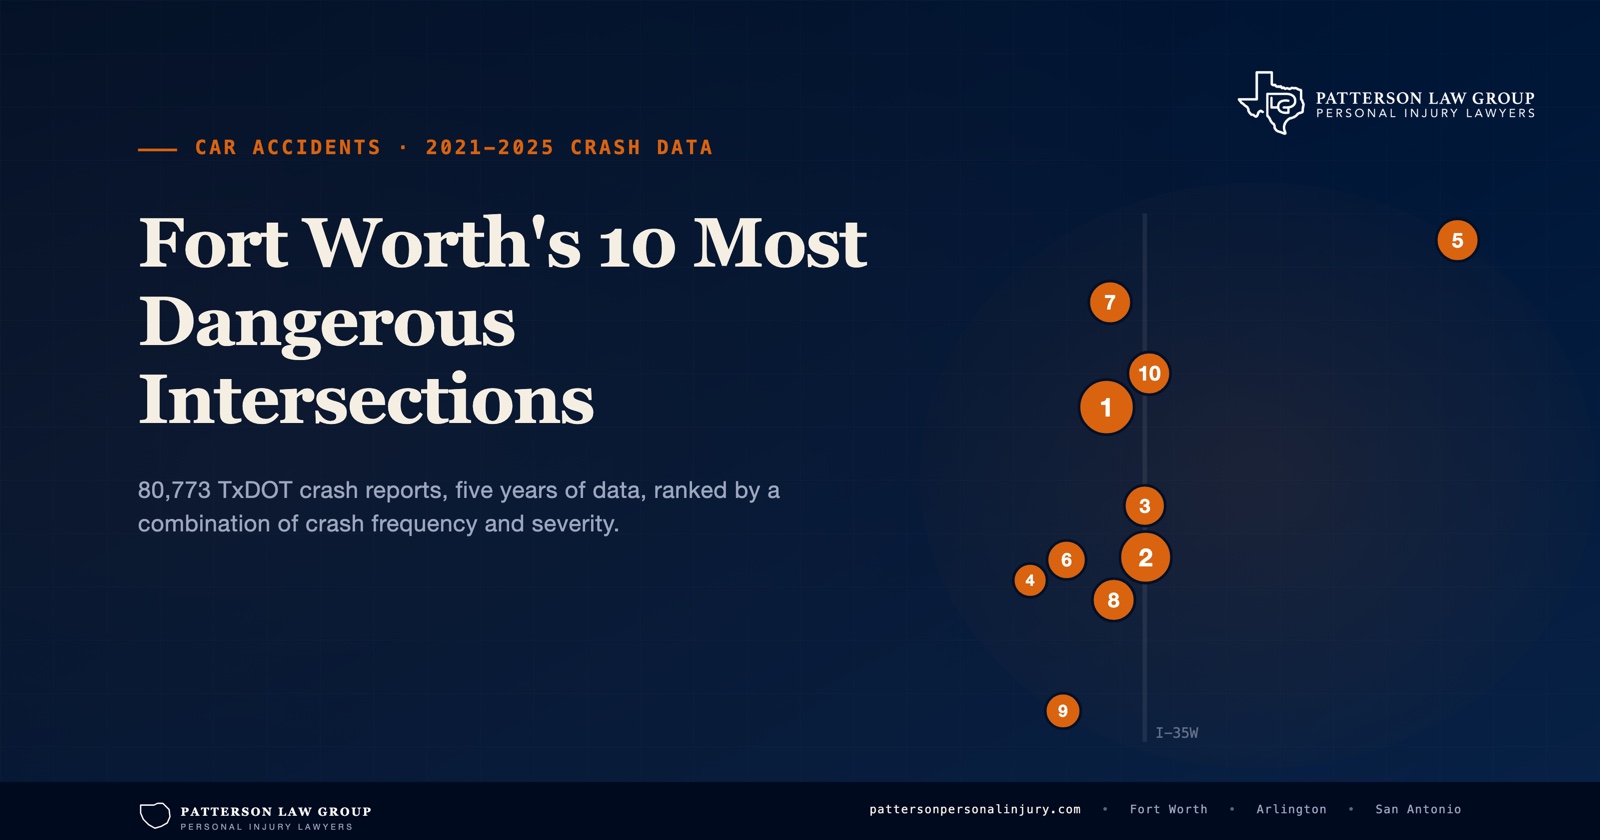
Intersection wrecks make up a big share of the car accident cases a Fort Worth injury firm sees, and the same stretches of road come up often enough that we wanted real numbers instead of impressions. So we pulled every police-reported crash inside the Fort Worth city limits from 2021 through 2025, 80,773 in all, straight from TxDOT’s crash database, and ranked every intersection in the city.
The ranking is not a simple crash count. It combines how often crashes happen at an intersection with how badly people get hurt there, so a wreck that sends someone to the hospital counts for more than a parking-lot bump. The 10 intersections that came out on top are on the map above and broken down below. The full top 50 is at the bottom of the page as a download, along with the map code if you want to put it on your own site.
What five years of crash data shows
Fort Worth police and other agencies reported 80,773 crashes inside the city between January 2021 and December 2025. Those crashes killed 603 people and left 2,679 with suspected serious injuries. About 43 percent of them, 34,776, happened at or approaching an intersection, and those intersection crashes killed 160 people.
The 10 intersections on this list produced 1,410 crashes in five years, about 4 percent of every intersection crash in a city of more than a million people. Someone was hurt in 493 of them. Twenty-four were fatal or catastrophic, and one person died.
Some numbers worth keeping:
- Left turns are the biggest single problem. Citywide, 31 percent of intersection crashes involved a vehicle turning left. At the top 10 it is 40 percent. At W Risinger Rd and S Hulen St it is 82 percent.
- Somebody ran the light or the sign in about 28 percent of intersection crashes. That is the share coded as an angle collision with both drivers going straight, which is usually how a red-light or stop-sign runner shows up in the data.
- Five of the 10 are frontage-road intersections. Two on I-35W (Seminary and Berry), two on I-20 (Hulen, and Crowley and James), one on SH 360.
- Pedestrians are 2 percent of the crashes and 26 percent of the deaths. Pedestrians were struck in 1,426 crashes citywide and 157 of them died. At intersections specifically, 506 crashes hit a pedestrian and 31 of those people were killed.
- A third of intersection crashes happen in the dark. 31 percent were coded dark or dusk. At the I-35W frontage roads it is closer to half.
- Four in 10 intersection crashes were at a traffic signal, and about one in four was at a stop sign.
- The worst hour is 4 to 5 p.m. and the worst day is Friday, both citywide and at intersections. Crashes at the top 10 pile up between 3 and 6 p.m.
The list
Ranked by Danger Score. Fatal and suspected serious injury crashes count 10, suspected minor injury 3, possible injury 1.5, and no-injury crashes 1. “Injury crashes” means at least one person was reported hurt. “Fatal or catastrophic” is the number of crashes in which someone died or was suspected of a serious injury.
| # | Intersection | Crashes | Injury crashes | Fatal or catastrophic | Killed | Danger Score |
|---|---|---|---|---|---|---|
| 1 | Henderson St at Belknap/Weatherford | 197 | 73 | 2 | 0 | 296 |
| 2 | E Seminary Dr at I-35W | 183 | 59 | 1 | 0 | 266 |
| 3 | E Berry St at I-35W | 130 | 45 | 5 | 1 | 216 |
| 4 | Overton Ridge Blvd at Chisholm Trail Pkwy | 100 | 46 | 7 | 0 | 214 |
| 5 | Trinity Blvd at SH 360 | 142 | 50 | 2 | 0 | 210 |
| 6 | S Hulen St at I-20 & Southwest Blvd | 126 | 56 | 0 | 0 | 206 |
| 7 | N Main St & NW 28th St | 142 | 40 | 1 | 0 | 204 |
| 8 | Crowley Rd & James Ave at I-20 | 142 | 42 | 1 | 0 | 196 |
| 9 | W Risinger Rd & S Hulen St | 105 | 49 | 4 | 0 | 195 |
| 10 | E Belknap St & Weatherford St at Grove St | 143 | 33 | 1 | 0 | 184 |
If you rank by raw crash count instead, the middle of the list shuffles but the top does not. Henderson at Belknap and Weatherford is first either way, and E Seminary at I-35W is second either way. The full top 50 is available below.
The top 10, up close
1. Henderson St at Belknap/Weatherford (downtown)
197 crashes, 73 with injuries. This is where Jacksboro Highway becomes Henderson Street and crosses the Belknap and Weatherford one-way pair on the west edge of downtown. The count moves around year to year, from a low of 24 in 2022 to 51 in 2025, and that 51 is the highest single-year count at any intersection in the city across the five years we analyzed. Four in 10 crashes here involve a left turn, and one type stands out: crashes where a car going straight hits a car beside it turning left run at 14 percent here against 4 percent at intersections citywide, nearly four times the rate. That is the signature of lane confusion. Henderson gives drivers two chances a block apart to turn onto a one-way street, and the lane you need changes between the two signals. Rear-end crashes, the usual sign of drivers stopping short at back-to-back lights, are actually below the citywide rate. The peak hour is 4 to 5 p.m. Three of the crashes hit pedestrians.
2. E Seminary Dr at I-35W
183 crashes, 59 with injuries. The frontage-road signals on either side of I-35W at Seminary are the most consistent trouble spot in the city, with 33 to 43 crashes every single year. Nearly half the crashes are angle collisions, meaning someone pulled across traffic. Nearly half happen after dark, and the peak hour is 8 p.m., not the afternoon rush. Eight crashes here struck pedestrians, the most of any intersection in the top 10.
3. E Berry St at I-35W
130 crashes, 45 with injuries, 5 fatal or catastrophic, 1 killed. One exit north of Seminary, with the same ingredients: frontage roads, angle crashes, 45 percent at night. Crashes dropped to 13 in 2024 and jumped back to 34 in 2025.
4. Overton Ridge Blvd at Chisholm Trail Pkwy
100 crashes, 46 with injuries, 7 fatal or catastrophic. Fewer total crashes than most of the top 10 but the worst injury rate on the list: nine suspected serious injuries in five years. Fifty-seven percent of crashes involve a left turn, almost all of them in daylight. This is where drivers coming off the tollway meet Hulen Mall traffic.
5. Trinity Blvd at SH 360
142 crashes, 50 with injuries. Far east Fort Worth, in the CentrePort area between DFW Airport and Arlington. The crashes split almost evenly between same-direction collisions (rear-end and sideswipe) and angle collisions, which is what a wide, fast, signalized intersection produces.
6. S Hulen St at I-20 & Southwest Blvd
126 crashes, 56 with injuries. Hulen crosses the I-20 frontage roads right next to the Southwest Boulevard interchange. Steady at 22 to 29 crashes every year. No fatal or catastrophic crashes, but the third-highest injury count on the list.
7. N Main St & NW 28th St (Stockyards)
142 crashes, 40 with injuries. Crashes here are climbing faster than anywhere else in the top 10: 13 in 2021, 48 in 2025, a 269 percent increase in five years. The easy explanation is the tourist crowd, but the crash reports do not back it up. The biggest piece of the increase is weekday afternoon rush hour, 2 crashes in 2021 and 21 in 2025, and the types that grew fastest are angle collisions, meaning someone ran the light, and same-direction crashes. That is what more through traffic looks like at a signal that has not kept up. Evening and weekend crashes grew too, but more slowly, and crashes at the surrounding Stockyards intersections have been flat over the same five years. The next block north, N Main at NW 29th, ranks 12th on its own and has been falling since 2022.
8. Crowley Rd & James Ave at I-20
142 crashes, 42 with injuries. Crowley Road and James Avenue both cross I-20 within a block of each other on the south side, and the frontage-road signals between them generate a crash every 13 days. Forty-four percent involve a left turn.
9. W Risinger Rd & S Hulen St
105 crashes, 49 with injuries, 4 fatal or catastrophic. The clearest left-turn problem in the city. Eighty-two percent of crashes here involve a left-turning vehicle and only 5 percent are classic T-bones. Seventy-eight percent of the crashes here are the specific kind where a left-turning driver and an oncoming driver collide. The signal is protected-permissive, meaning drivers get a green arrow and then a green ball. Crash reports do not record which signal was showing at the moment of impact, so the data cannot tell us whether these happened on the arrow or on the green ball. What it does show is the crash pattern that protected-only phasing exists to prevent, and 82 percent is far above the citywide 31 percent.
10. E Belknap St & Weatherford St at Grove St
143 crashes, 33 with injuries. The east end of the Belknap and Weatherford pair, where downtown traffic funnels toward I-35W. Sixty-four percent of crashes are same-direction, meaning rear-end and sideswipe, the highest share on the list. That points to congestion and lane changes rather than red-light running.
Just outside the top 10
A few intersections ranked 11 through 25 deserve a mention, because the pattern at some of them is worse than the raw rank suggests.
- Miller Ave & Wilbarger St at US 287 (No. 11): 117 crashes, but headed the right direction. It went from 36 crashes in 2021 to 13 in 2025.
- Trinity Blvd & Euless S Main St (No. 13): only 71 crashes, but 43 of them with injuries, the highest injury rate of any intersection in the top 25. Seven fatal or catastrophic crashes, one death, and 82 percent involve a left turn, the same share as Risinger and Hulen.
- Camp Bowie West Blvd at Loop 820 (No. 15): 33 crashes in 2025 alone, up from 16 the year before.
- University Dr at I-30 (No. 21): 63 percent of crashes happen in the dark and the peak hour is 2 a.m. It is the only intersection in the top 25 whose crashes peak in the middle of the night.
- S Riverside Dr & E Berry St (No. 23): 69 crashes but three deaths, the most of any intersection in the top 25.
Why these intersections
A few patterns run through the whole list.
Frontage roads. Five of the 10 are frontage-road intersections along I-35W, I-20, SH 360 and the Chisholm Trail Parkway. Drivers coming off a freeway exit are still carrying freeway speed and freeway attention. Drivers on the cross street have to clear two wide, fast signals in a row. The roads belong to TxDOT, or to the NTTA at the Chisholm Trail Parkway, not to the City of Fort Worth.
Left turns. Left-turn crashes show up again and again. W Risinger and S Hulen (82 percent) and Overton Ridge at Chisholm Trail (57 percent) both run far above the citywide rate of 31 percent. Where a signal lets drivers turn left on a green ball and judge the gap themselves, converting to protected-only phasing is the standard countermeasure, and these two are the strongest candidates for it in the city.
Night. A third of crashes at the top 10 happen in dark or dusk conditions, and at the I-35W frontage roads it is closer to half. E Seminary at I-35W peaks at 8 p.m. and its worst day is Sunday.
Growth. Crash counts are climbing year over year in the Stockyards (N Main and 28th) and on the far south side (Risinger, Crowley Road). Roads built for a smaller Fort Worth are carrying a bigger one.
Where we can help
Fort Worth is one of the fastest-growing large cities in the country, and a lot of what this data shows is a city absorbing more traffic than its roads were built for. Nobody designed these intersections to fail. They are carrying volumes nobody planned for.
The good news is that the patterns here point at known countermeasures. Where the left-turn share runs far above the citywide rate, protected-only left-turn phasing is what traffic engineers reach for, because it takes the gap judgment away from the driver. Where close to half the crashes happen after dark, as at the I-35W frontage roads, lighting and signal visibility are the first things to look at. Where crashes climb year over year, as at N Main and 28th, it is worth checking whether signal timing has kept up with the new volume.
These intersections are spread across three agencies. The frontage roads and state highways belong to TxDOT’s Fort Worth District, the Chisholm Trail Parkway belongs to the NTTA, and the surface streets belong to the City of Fort Worth, whose Transportation and Public Works Department also maintains more than 100 TxDOT-owned signals under agreements with the state. We built this analysis to be useful to them. Any of the three can have the full intersection-level data, free, by asking. If it helps them make a case for funding or moves one intersection up a project list, that is the whole point.
If you drive through these intersections
Treat a green ball on a left turn as a yield, not a go. Look twice for motorcycles and pedestrians before you turn. On a frontage road, expect the car exiting the freeway to be moving faster than it looks, and expect the car in front of you to stop short at the second signal.
If you were hurt at one of these intersections
The intersection’s history matters to your case. A location with 100 prior crashes and a documented left-turn problem is a very different thing from a random fender bender, and it is the kind of evidence our Fort Worth car accident lawyers use. In an intersection accident case, the crash history for that location, the signal timing records, and any prior complaints to the city or TxDOT are all records that can be requested and used. If the other driver failed to yield on a left turn or ran the red light, the pattern at that intersection helps prove it.
Two things to do early. Get the crash report, because the officer’s coding of the collision type and contributing factors is what the insurance adjuster will read first. And write down the signal state as you remember it before the details fade. Here is what to do after a Fort Worth car accident, step by step. If you were on foot, our Fort Worth pedestrian accident lawyer page covers the rules that apply to you.
Contact us for a free consultation. There is no fee unless we win.
Methodology
Source. Texas Department of Transportation Crash Records Information System (CRIS), the statewide database of police-reported crashes (Texas Peace Officer’s Crash Report, form CR-3). We queried every crash with a City of Fort Worth location and a crash year of 2021 through 2025, as the database stood on September 2, 2026. That returned 80,773 crashes.
Intersection crashes. We kept the 34,776 crashes that officers coded as “intersection” or “intersection related,” and dropped crashes coded as non-intersection or driveway access.
Locating intersections. Rather than trust the street names typed on each report (which for state highways are route codes like “BU0287P” and “SH0183”), we grouped crashes by their reported GPS coordinates. Crashes within about 165 feet of each other were clustered, with no cluster allowed to exceed 300 feet across. Adjacent clusters that shared a road, such as the two frontage-road signals on either side of a freeway or the two halves of a one-way pair, were combined into one intersection when they sat within about 425 feet of each other. Each intersection was then named from the OpenStreetMap roads at that location and checked by hand.
Exclusions. Freeway main-lane crashes near interchanges (for example, on I-35W itself at NE 28th Street) were excluded because they are not intersections a driver crosses. One group of 105 crashes coded “BU 287P at SH 183” but plotted in a rail yard with no roadway was excluded as unlocatable. 81 intersection crashes had no coordinates.
Danger Score. Each crash is weighted by the most severe injury reported: fatal (K) or suspected serious injury (A) crashes count 10, suspected minor injury (B) 3, possible injury (C) 1.5, and no injury or unknown 1. Fatal and serious injuries are grouped together because five years of data at a single intersection produces only a handful of each, and separating them would let a single death swing the list. The weights follow the “equivalent property damage only” approach used in traffic-safety engineering, simplified for readability.
Caveats. CRIS includes only crashes reported to police with at least $1,000 in damage or an injury. GPS coordinates on crash reports are imperfect and some crashes are plotted at a nominal point rather than the exact location. Traffic volume was not available, so this list ranks intersections by harm, not by risk per vehicle.
Download the data
Each file has the rank, intersection name, total crashes, injury crashes, fatal or suspected serious injury crashes, deaths, suspected serious injuries, Danger Score, and the latitude and longitude of the intersection.
For reporters and public officials
The map, the tables and the data files are free to republish with a link to this page. Suggested credit: “Patterson Law Group analysis of TxDOT CRIS crash data, 2021-2025.”
We can also provide the full 80,773-crash dataset, our intersection-level results for every cluster in the city, and a breakdown of any single intersection by year, hour, collision type, lighting and injury severity. Email travis@pattersonpersonalinjury.com and say which intersections you are interested in.
Embed this map on your site
Copy this code onto any page. The credit link back to this analysis is part of the deal.
<iframe src="https://pattersonpersonalinjury.com/embeds/fort-worth-dangerous-intersections/" width="100%" height="900" style="border:0" loading="lazy" title="Fort Worth's 10 Most Dangerous Intersections map"></iframe><p>Map: <a href="https://pattersonpersonalinjury.com/blog/fort-worth-most-dangerous-intersections/">Fort Worth's 10 Most Dangerous Intersections</a> by Patterson Law Group</p>